Reports and posting back
Pull your first report
Run any report from Xero, QuickBooks Online or Zoho Books into Excel and refresh it whenever the books change. We use the profit and loss here because every set of books has one. The other reports work the same way.
- Less than 2 minutes


 Xero, QuickBooks Online, Zoho Books and more
- Excel for Windows and Mac
Before you start
- Connected your entity? If not, start with Connect Xero to Excel or Connect QuickBooks Online to Excel. Zoho Books connects from the same screen in the Rows portal.
- The Rows pane open in Excel on the Dashboard, with your entity's name under the Rows logo.
From your books to a live report
Find the profit and loss
In ExcelWith your entity's name under the Rows logo, select Run Report on the Dashboard. Every report Rows can pull for that entity is listed here: 16 on Xero, more than 30 on QuickBooks Online and more than 70 on Zoho Books. For this guide, type profit in the search box and choose Profit and Loss - Multiple Periods under Rows Reports. On Zoho Books, choose Profit and Loss under Business Overview.
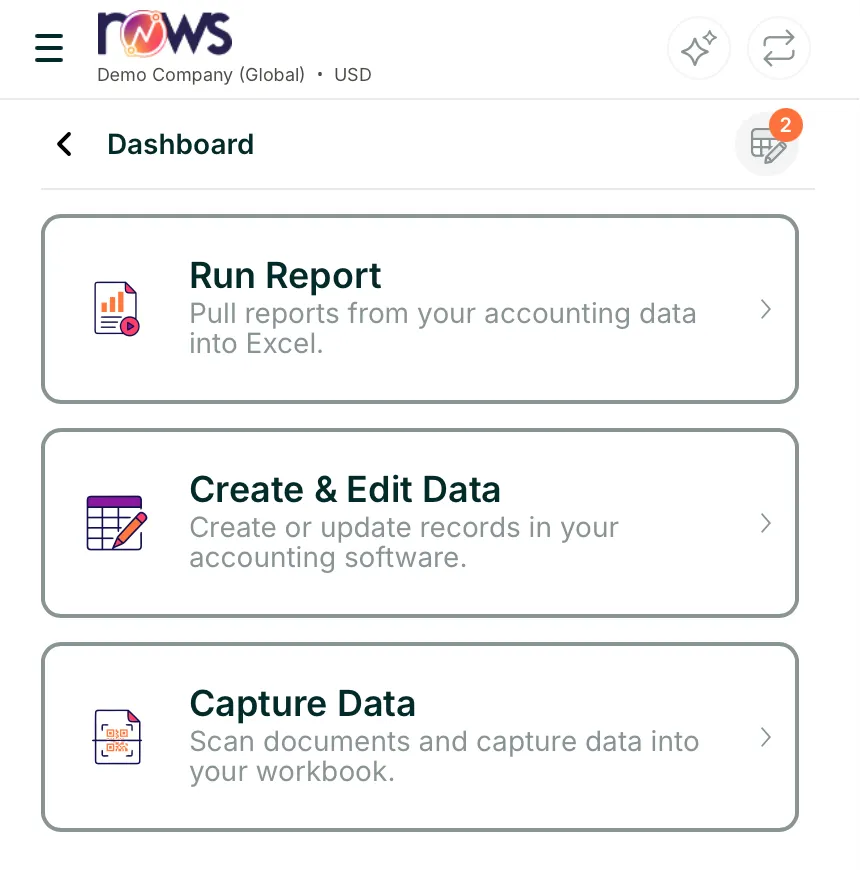
Rows pane, Dashboard 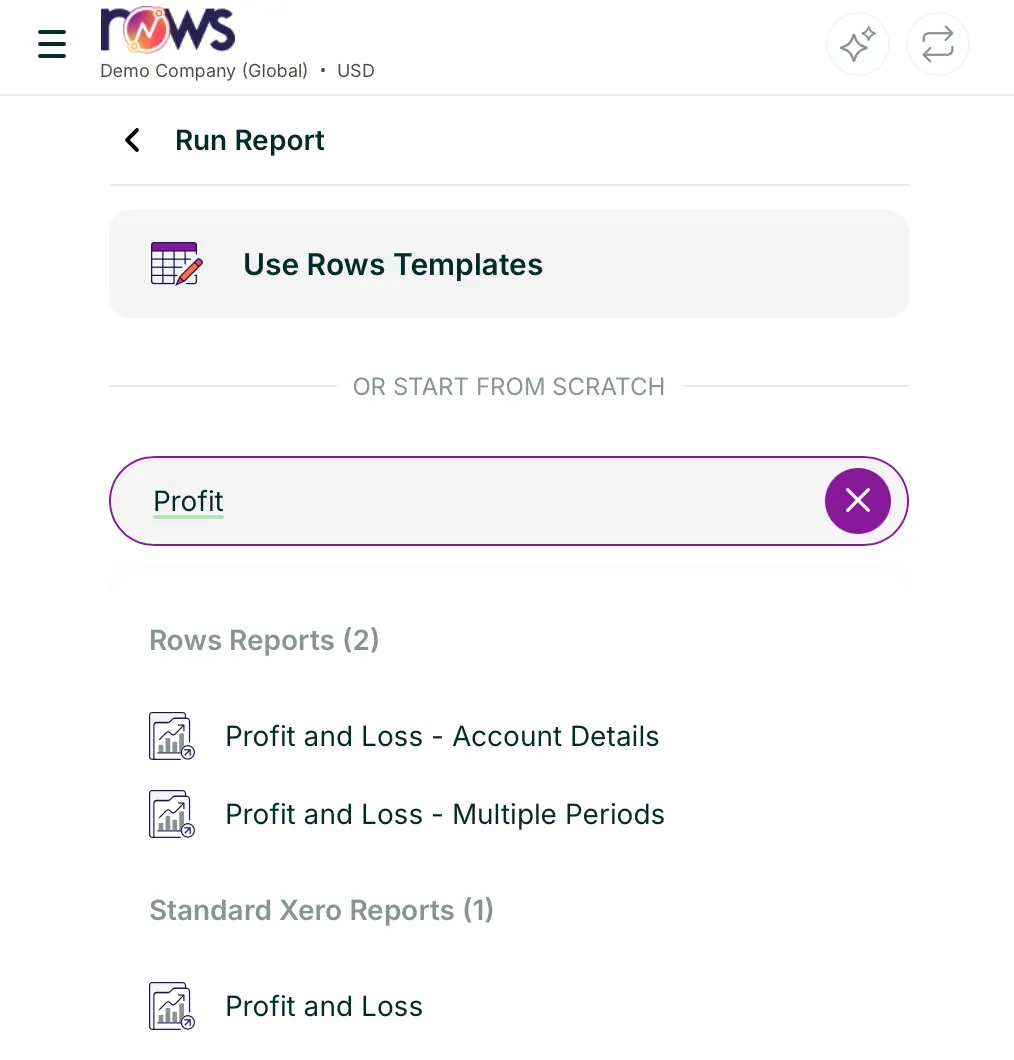
Rows pane, search for the report Choose the months and run it
In ExcelUnder Date, pick the month to report on. Leave Period on Previous Months and set Total Periods to how many earlier months you want beside it: 1 gives you October and September side by side. The other settings can stay as they are. Then select Run Report to fill the sheet you're on, or Run Report on a new Sheet to keep it apart from what's there. On Zoho Books the profit and loss covers one period, so you pick a Date Range and Report Basis instead.
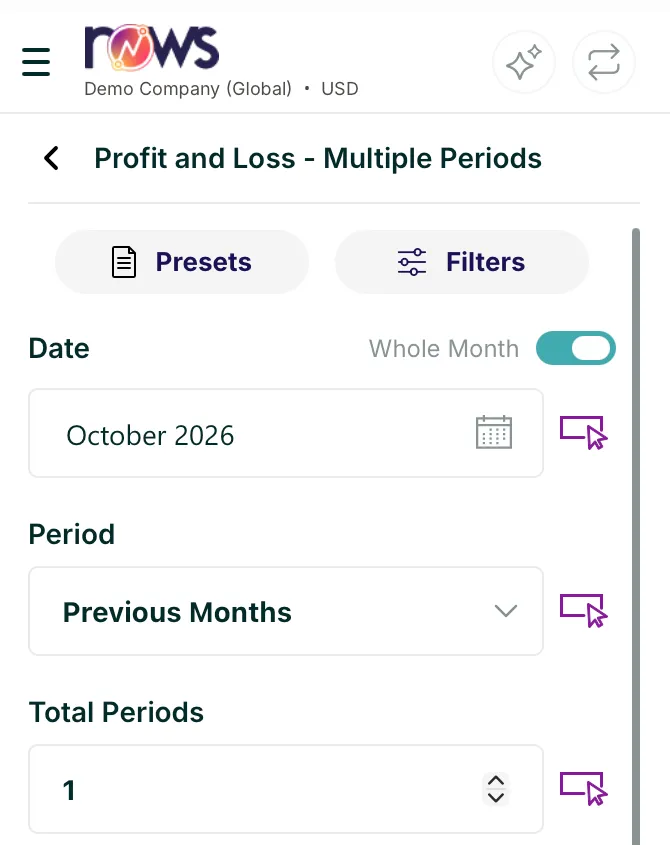
Rows pane, choose the month 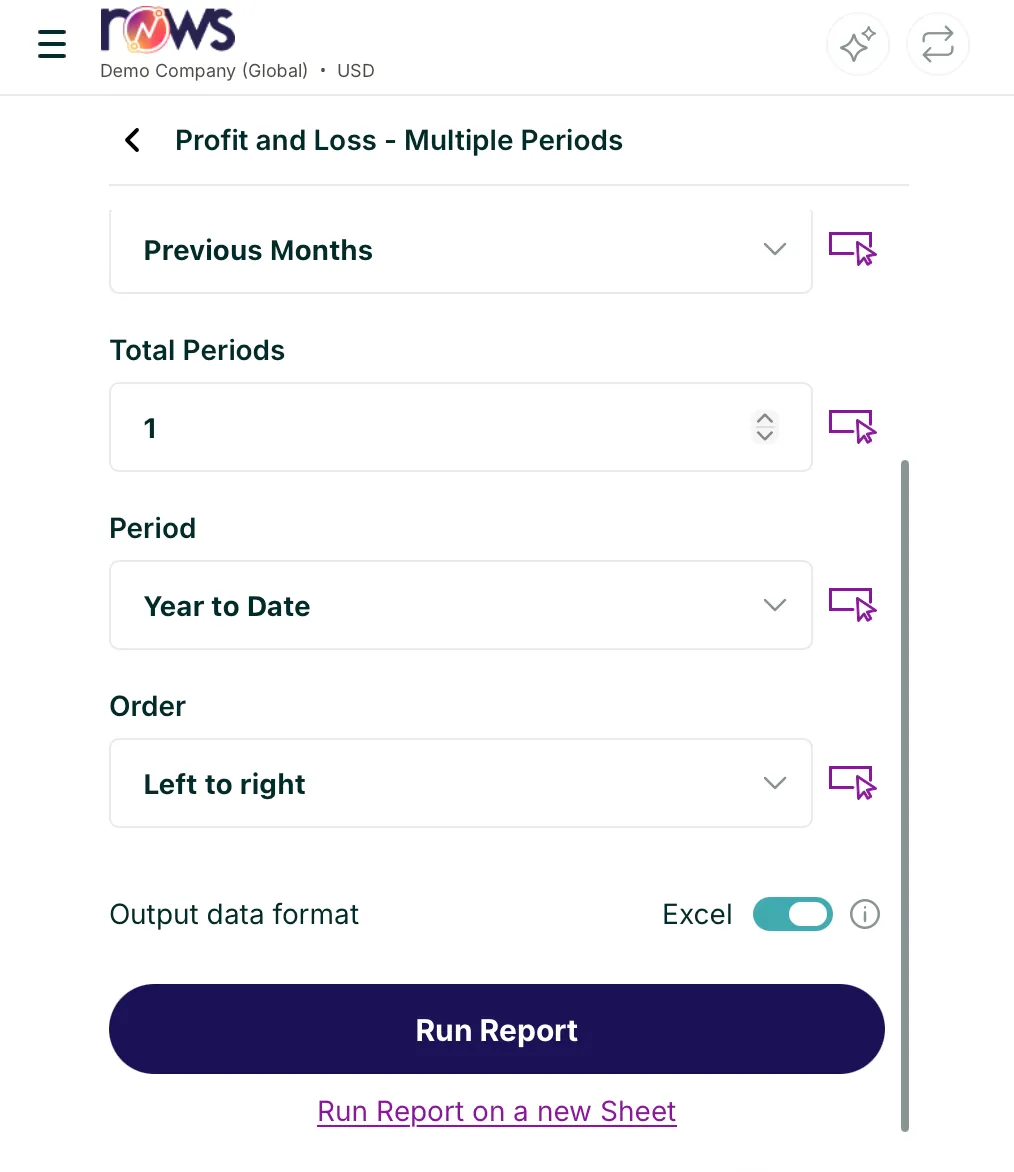
Rows pane, Run Report Read the report
In ExcelThe report lands in a tab named after it. Row 1 shows the entity, the report name and when it ran. Below that is a navy header row with filters (it's an Excel Table), then Income, Cost of Sales and the rest, each with its subtotal. Use the 1 and 2 buttons on the left to fold the accounts away and see only the totals.
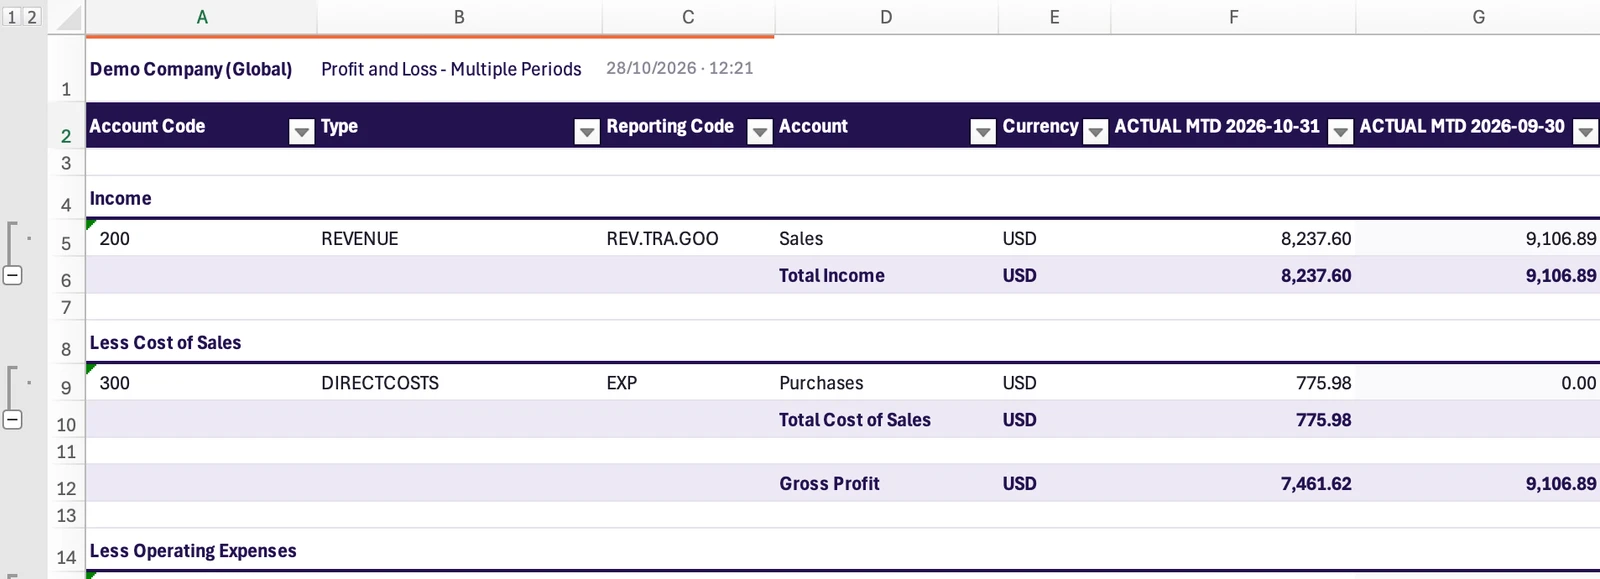
Excel for Mac, the report in its own tab Refresh it
In ExcelEach Rows sheet in the workbook has a card in the pane showing its Last sync time. When the books change, select the refresh arrow on a card to update that report, or tick several cards and select Refresh selected sheets. A refresh takes under a minute and the figures change in place.
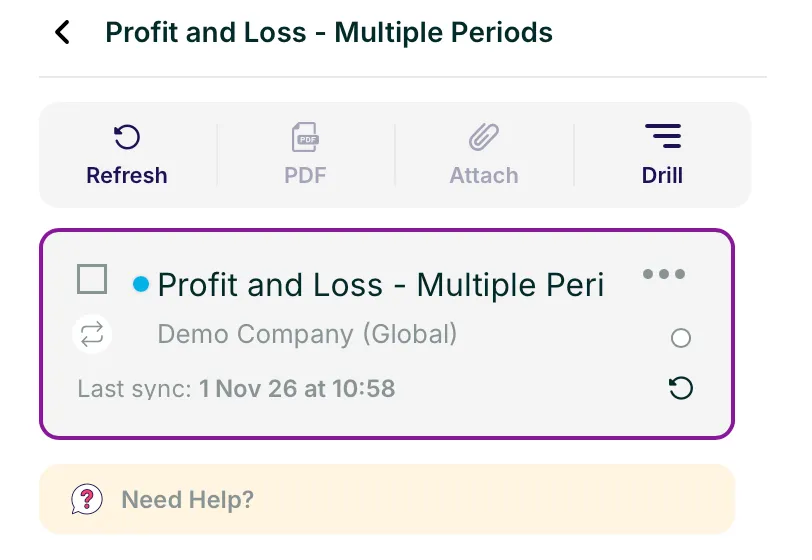
Rows pane, refresh one report 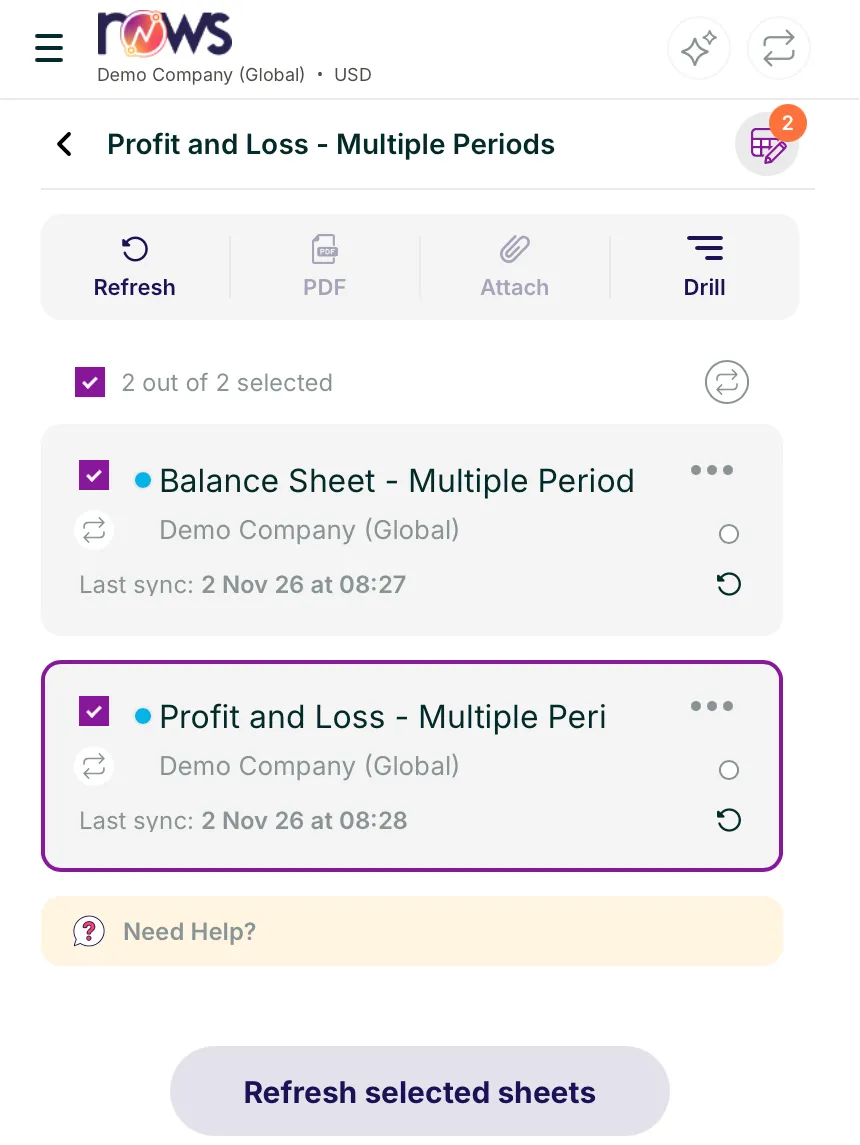
Rows pane, refresh several at once Add your own formulas
In ExcelType your own formulas in the column straight after the report, for example the change between two months. Excel takes the column into the report's table, and it's still there after every refresh.
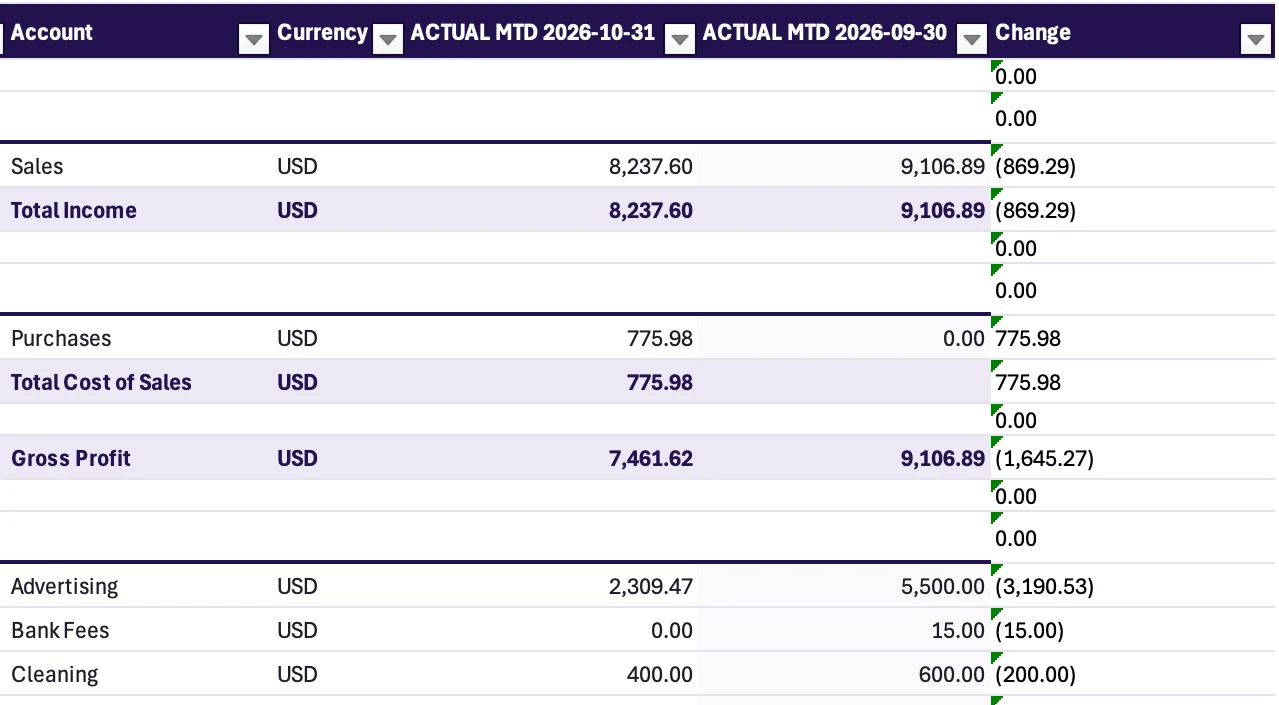
Excel for Mac, your own Change column


If something goes wrong
I can't find the report
Check your entity's name shows under the Rows logo, then type part of the report name in the search box (profit, balance, trial). Or open Rows Reports in the list: the profit and loss, balance sheet and trial balance over several periods are all there.
The figures look out of date
Look at Last sync on the report's card. If it's older than your latest changes, select the refresh arrow on the card. Anything saved in your books after that time shows up on the next refresh.
The report stops with "Organisation not authorised"
The link between Rows and your books has dropped, and the entity shows Reconnect in the Rows portal. Open Entities in the portal, select Reconnect, allow access again, then run the report once more. The connect guide for your platform (see Before you start) has the full steps.
My own columns disappeared after a refresh
Formulas in the column straight after the report become part of its table and stay through a refresh. Hidden columns and number formats inside the report's own columns can reset when it refreshes, so keep those changes in your own columns.
Next step
Next guideUse a report templateStart from a ready-made Rows template, such as a management report, and fill it from your own entity.Want to send figures the other way? Read Post journals and records from Excel. Looking for something else? Browse every guide in the Help centre.
Talk to a person.
Email support
Tell us what you see on screen. We reply within 24 hours on working days.
support@rowsapp.comBook an onboarding call
Free during your trial. We'll connect your entities with you and set up your first live report.
Book a call